Does Increasing Taxes Reduce the Deficit?
Or does it just enable greater borrowing?
A friend and I have a shared belief that the UK’s large national debt and ongoing budget deficit is a problem1. However, he’s less concerned about the total tax burden than I am and, on a number of occasions, has suggested that a particular tax rise or another was a good thing, because it would reduce the deficit.
This always had a certain compelling logic to me. Despite a sneaking suspicion that the Government might only, in the immortal words of Boris Johnson, be going to spaff it up the wall, surely, surely, increasing revenues would help to close the deficit.
However, Rachel Reeves’s recent Budget - in which she increased taxes by £40bn2 and, simultaneously, borrowing by £30bn - made me start thinking again. Does raising taxes really help reduce the deficit? Or does it just let the Government borrow more? What does the evidence say?
Before I’m accused of embracing outlandish economic theories let me first state that, obviously, if no other changes are made, increasing the tax take will of course reduce the deficit. But the operative phrase is if no other changes are made. We have to consider the behavioural responses. Governments don’t actually make no other changes. So what do they do?
As an analogy, imagine if we gave everyone buying a home a free £20,0003. Would that reduce the size of mortgages?
A simplistic take would be that it would, because people wouldn’t have to borrow as much. But thinking a moment longer shows there are three possibilities:
Some people might be determined to buy a particular house. For them, this policy would make their mortgage smaller.
Some people might want to borrow a specific amount. They would use this money to buy a nicer house that was £20,000 more expensive. For them, this policy wouldn’t change the size of their mortgage.
Some people might want to get the nicest house they could, with as much money as the bank was willing to lend them. Let’s assume for simplicity this means keeping the same loan to value ratio. For them, this policy would mean they could borrow more - potentially significantly more - and so their mortgages would get bigger4.
In reality, some people would fall into each of the three camps and we would need to look at what actually happened to find out how the policy changed the average mortgage5.
Taking this back to the Government6, we can see that these equate to three possibilities:
The Government wants to spend a fixed amount of money. In this case, a tax rise will reduce the deficit.
The Government is willing to borrow a certain amount of money. In this case, a tax rise will make no difference to the deficit.
The Government wants to spend and borrow as much as it can persuade the bond markets to lend it. Just as a larger deposit persuades a bank to lend a house-buyer more, raising taxes can reassure the bond markets. In this case, a tax rise will allow the deficit to increase7.
So what actually happens? Let’s look at the data.
The graph below shows Net Borrowing8 and the total tax take9, both as a share of GDP, from 1971 to the present. As we can see, both fluctuate up and down considerably.
But what we are interested is how they change. Does raising taxes reduce the deficit? If taxes go up by 1% of GDP, does the deficit decrease - and if so, how much?
Let’s have a look. The graph below shows the annual delta of each of the lines plotted above, with the annual change in net borrowing10 plotted against the annual change in the tax take11.
Your immediate impression is likely to be that there doesn’t appear to be any obvious correlation to these two things - and your immediate impression would be correct. The correlation coefficient is -0.03: as close to perfectly uncorrelated as makes no difference, and not remotely statistically significant12.
There was one final thing to check13. Maybe different parties take different approaches. Perhaps the Tories raise taxes to reduce the deficit, but Labour raises taxes to let them borrow more.
What does the data say? Let’s split up the years and look at Labour and Conservative governments seperately.
Labour Governments
If you squint very hard you may be able to see a slight downwards slope to the data points. The correlation coefficient here is -0.12 - which in principle means that a Labour Government raising taxes is actually more likely to also be increasing the deficit - but the effect is nowhere near statistically significant.
Are the Tories any better?
Conservative Governments14
Here we get an even smaller correlation coefficient of 0.007, which is in any case 97% likely to be due to chance.
I valiantly decided to give the Conservatives a second chance by deleting the two COVID years from the data set as well as the graph. This pushed up the correlation coefficient to a mighty15 0.10 - broadly similar to Labour’s, but in the opposite (better) direction - but again, this was not statistically significant16.
What can we conclude?
If you’re determined to be partisan, you could try to argue that a Conservative Government that raises taxes is more likely to reduce the deficit than a Labour Government17 - and that’s not completely false but, honestly, you’re really stretching it.
A much better conclusion would be to treat raising taxes and reducing the deficit as essentially orthogonal. There have been governments that have genuinely been committed to reducing the deficit, but these have done this while raising taxes (New Labour, 1997 - 2001), while keeping taxes essentially flat (Coalition 2010 - 2016)18, and while reducing taxes (Thatcher, 1984 - 1989).
If you prioritise a low deficit19 judge parties on this, explicitly, on their record, or on their pledges - though the latter is often hard to do.20 One good way might be to look at the specifics of their pledges or fiscal rules, with very explicit promises, such as Tony Blair’s commitment to match Tory spending plans, or Osborne’s fiscal rules, being more meaningful than the Augustinian fiscal rules that both parties have been adopting more recently21.
Similarly, for those who believe low taxes are beneficial, all taxes should ideally be as in your face and obvious possible. That mainly means income tax and some form of property tax22, though I’ll give behavioural taxes a pass, if they’re genuinely primarily about deterring an undesirable activity23 or pricing in the externalities24 rather than revenue raising. If many governments will spend what they can get away with we want the maximum moo for every drop of milk - so we can keep them in line. The corrolary, of course, is that those who wish government spending to rise should favour the reverse, i.e. stealth taxes - which Blair and Brown understood very well.
But regardless of your views on the optimal level of taxation, don’t assume that tax rises will help to balance the budget. The last 50 years show they are almost entirely uncorrelated - whichever party is in power.
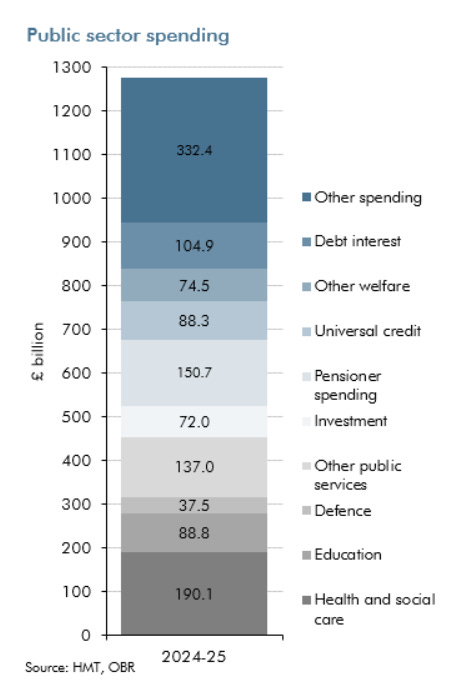
As a reminder, the national debt is at 97.5% of GDP, while net borrowing is well over £100bn. While this would have been a problem even when interest rates are low, with the current, more normal, interest rates, we are expected to spend £105bn on debt interest this year. That’s about 8% of all public spending, or more than we spend on education - and well over double the defence budget
.
Taking tax as a share of GDP to an all-time post-war high.
This would be a remarkably stupid policy. Please don’t do it.
For example, someone with a £100k deposit and a deposit to value ratio of 20% could buy a £500k house - borrowing £400k. The extra £20k would allow them to purchase a £600k house with the same deposit to value ratio - increasing their mortgage to £480k.
Well, in the UK, given our heavily supply-constrained market, we can be fairly confident that this - like every other form of demand-side stimulus - would increase house prices and the size of mortgages. But in principle we would have to observe it, and different markets and populations would respond in different ways.
And yes, the national economy is not like a household budget in many very important ways, but in some ways - like this one - one can find meaningful analogies.
This third position is most analogous to the recent Reeves Budget.
A positive change in net borrowing means that the deficit reduces.
Note that the y-axis has been truncated at +5/-5 for visibility reasons meaning that the two COVID years are off the scale - one in either direction.
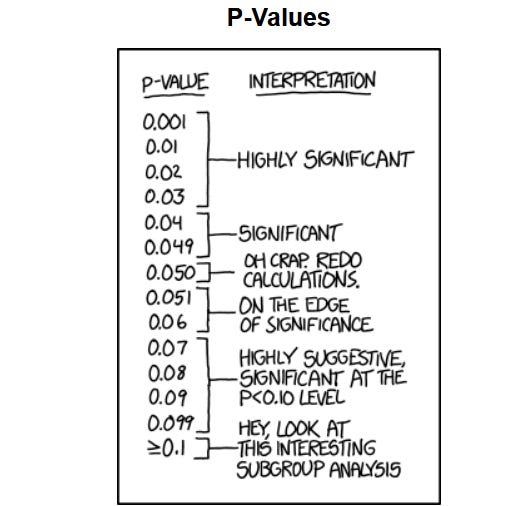
p = 0.84! Even the famous xkcd chart won’t help you with that one:
Hey, look at this interesting subgroup analysis!
Again, the COVID years are omitted from the graph, but are included in the data for the purposes of calculations.
Really not mighty.
p = 0.58,
Maybe because the Conservatives don’t like putting up taxes and perhaps only do so when they really have to.
Taxes did creep up, but only by 0.4% of GDP, while the deficit fell from -10.3 to -2.9% of GDP.
Or even a surplus!
Though I wasn’t thrilled about many of Labour’s plans pre-election, I had actually thought that Reeves was committed to fiscal responsibility. More fool me.
O Lord, give me a balanced budget - but not yet.
Council tax, Georgist land tax, etc. - take your pick.
E.g. smoking.
E.g. fuel tax or road pricing.


Really appreciate the analysis. I shall revise my policy evaluation accordingly!
This is a very good article and explains very well why we never get out of debt.